Basic interpolation
[1]:
%matplotlib inline
import numpy as np
from cem_gridtools.cem_gridtools import NN
import matplotlib.pyplot as plt
[2]:
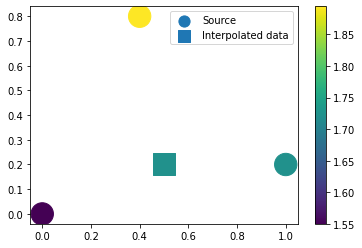
# Define input data
x = np.array([0, 1,   0.4], dtype='d')
y = np.array([0, 0.2, 0.8], dtype='d')
z = np.array([1, 2, 3], dtype='d')
[3]:
# NN interface
I = NN(x,y,z,"nn_sibson")
xo = 0.5
yo = 0.2
V = I.interp(xo, yo)
[4]:
plt.scatter(x,y,s=500,c=z,label='Source')
plt.scatter(xo, yo, s=500, c=V, marker='s', label='Interpolated data')
plt.colorbar()
plt.legend(markerscale=0.5)
[4]:
<matplotlib.legend.Legend at 0x7f0e22776ba8>
[7]:
# Or the points to interpolate onto may be a vector
xo = np.array([0.5, 0.5, 0.5, 0.5, 0.5], dtype='d')
yo = np.array([0, 0.15, 0.3, 0.6, 0.7], dtype='d')
V = I.interp(xo, yo)
[6]:
plt.scatter(x,y,s=500,c=z,label='Source')
plt.scatter(xo, yo, s=500, c=V, marker='s',label='Interpolated data')
plt.colorbar()
plt.legend(markerscale=0.5)
[6]:
<matplotlib.legend.Legend at 0x7f0e2206d588>

[ ]: